The application has no user interface, it simply emails the alerts as and when they occur. The current version checks for the available space, SMART variables described below and Hard drive errors caught from Windows Event log. This basically includes all accurate ways of predicting server failure due to hard drive problems.
The hard drive monitor has been built with .Net 2.0 for Pulse engineers and is currently monitoring 100s of critical web servers.
The latest version features SMART Hard drive monitoring features as well!
Smart Hard drive variables that the software detects and reports on
- Raw_Read_Error_Rate: Indicates the rate of hardware read errors that occurred when reading data from a disk surface.
- Throughput Performance: Overall (general) throughput performance of a hard disk drive.
- Spin-Up Time: Average time of spindle spin up (from zero RPM to fully operational [millisecs]).
- Start/Stop Count: A tally of spindle start/stop cycles.
- Reallocated Sectors Count: Count of reallocated sectors.
- Seek Error Rate: Rate of seek errors of the magnetic heads.
- Power-On Hours (POH): Count of hours in power-on state.
- Spin-Up Time: Average time of spindle spin up (from zero RPM to fully operational [millisecs]).
- Spin Retry Count: Count of retry of spin start attempts.
- Recalibration Retries: This attribute indicates the number of times recalibration was requested (under the condition that the first attempt was unsuccessful).
- Device Power Cycle Count: This attribute indicates the count of full hard disk power on/off cycles.
- Power-On Hours (POH): Count of hours in power-on state.
- Soft Read Error Rate: Uncorrected read errors reported to the operating system. If the value is non-zero, you should back up your data.
- Spin Retry Count: Count of retry of spin start attempts.
- Temperature Difference from 100: Value is equal to (100 – temp. °C), allowing manufacturer to set a minimum threshold which corresponds to a maximum temperature.
- Load/Unload Cycle: Count of load/unload cycles into head landing zone position.
- Soft Read Error Rate: Uncorrected read errors reported to the operating system. If the value is non-zero, you should back up your data.
- Temperature: Current internal temperature.
- Hardware ECC Recovered: Time between ECC-corrected errors.
- Soft Read Error Rate: Uncorrected read errors reported to the operating system. If the value is non-zero, you should back up your data.
- Reallocation Event Count: Count of remap operations. The raw value of this attribute shows the total number of attempts to transfer data from reallocated sectors to a spare area. Both successful & unsuccessful attempts are counted.
- Current Pending Sector Count: Number of “unstable” sectors (waiting to be remapped). If the unstable sector is subsequently written or read successfully, this value is decreased and the sector is not remapped. Read errors on the sector will not remap the sector, it will only be remapped on a failed write attempt.
- Uncorrectable Sector Count: The total number of uncorrectable errors when reading/writing a sector.
- Soft Read Error Rate: Uncorrected read errors reported to the operating system. If the value is non-zero, you should back up your data.
- UltraDMA CRC Error Count: The number of errors in data transfer via the interface cable as determined by ICRC (Interface Cyclic Redundancy Check).
- Write Error Rate: The total number of errors when writing a sector.
- G-Sense Error Rate: The number of errors resulting from externally-induced shock & vibration.
- Soft Read Error Rate: Uncorrected read errors reported to the operating system. If the value is non-zero, you should back up your data.
- Power-Off Retract Cycle: The number of times the magnetic armature was retracted automatically as a result of cutting power.
- Write Error Rate: The total number of errors when writing a sector.
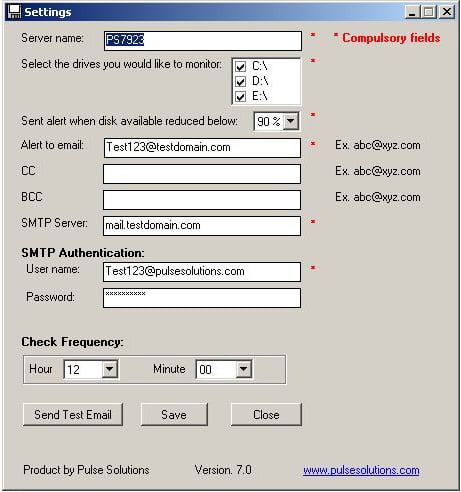
Help Manual
Server name:
Name of the server for the alert email subject. Keep this as descriptive as possible. E.g. Exchange box on 2nd floor
Select the drives you would like to monitor:
Choose the dives to be monitored from the list of drives the software found on your computer. Avoid removable drives to ensure you don’t get false errors when the drive is removed.
Sent alert when disk available reduced below:
This is the alert threshold, if the amount of space reduces to the selected percentage the software will send you an alert.
Alert to email:
Email address of alert recipient. This must be a valid email address that will receive alerts.
CC:
Carbon copy, alternate email address that should receive the alerts.
BCC:
Blind carbon copy, alternate email address that should receive the alerts.
SMTP Server:
Address of SMTP Server through which the Disk Alert email will be sent. This is usually the domains email server e.g. mail.yourcompanyname.com
User name:
This is the SMTP authentication, usually your email address.
Password:
This is the email address password, this would not be sent out. It will only be used to send you a secure email.
Check Frequency:
Select values from Hour and Minute drop down list to set the time when the Disk Alert utility checks your drives daily. E.g. Value in Hour drop list is “12” and Minute drop down “10”, the application will monitor the hard drives at 12:10 pm.
Send Test Email:
This can be used to test email settings. The test alert will be sent to the primary and all copy email addresses.
Save:
This will save the configuration you just created and request a restart of the service so the settings can be applied immediately.
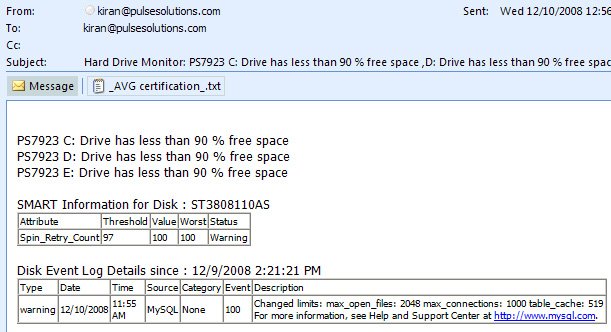
Sample email: Disk space low

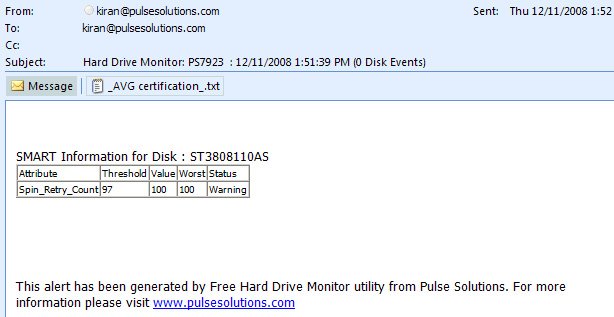
Sample email when a SMART variable exceeds permissible limits

